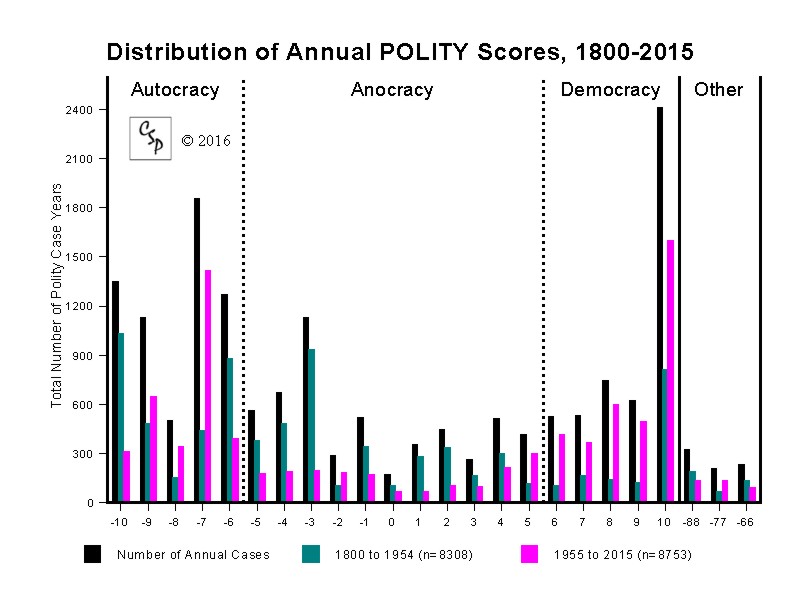
|
|
||||||||||||||||||||||||||||||||||||||||||||||||||||||||||||||||||||||||||||||||||||||||||||||||||||||||||||||||||||||||||||||||||||||||||||||||||||||||||||||||||||||||||||||||||||||||||||||||||||||||||||||||||||||||||||||||||||||||||||||||
|
This chart
displays the Distribution of Annual POLITY Scores in the annual
times-series version of the Polity IV dataset. The black bars display
the distribution for the entire data series, 1800-2006, and the color
bars show the distribution for the "classic Westphalian state-system"
(1800-1954) and the contemporary "global system of states."
The most dramatic differences between the two periods, in addition to
the absence of local polities governing the colonial territories during
the classic period, are 1) the concentration of personalist and corporatist
(-7) autocracies in the contemporary period contrasting with the range
of monarchies and reformist monarchies that dominated the classic period
and 2) the (very recent) emergence of democratic polities in the contemporary
period. The "local polities governing the colonial territories"
during the classic period are subsumed by the imperial states in the
Westphalian state-system. Earlier versions of the Polity data series
included imcomplete information on these "local polities"
by including data on "self-governing territories." This "hybrid"
classification of "non-state" polities was almost invariably
coded as "partially democratic" by definition and, thus, imparted
a systematic bias to the data series. The Polity IV version includes
only independent, state polities in the data series. In addition, the
data series does not include "micro-states," that is, independent
states with total populations less than 500,000 in the most recent year.
The Polity IV data series covers 162 independent states in 2006 and
is updated annually.
|
||||||||||||||||||||||||||||||||||||||||||||||||||||||||||||||||||||||||||||||||||||||||||||||||||||||||||||||||||||||||||||||||||||||||||||||||||||||||||||||||||||||||||||||||||||||||||||||||||||||||||||||||||||||||||||||||||||||||||||||||
![]() |
||||||||||||||||||||||||||||||||||||||||||||||||||||||||||||||||||||||||||||||||||||||||||||||||||||||||||||||||||||||||||||||||||||||||||||||||||||||||||||||||||||||||||||||||||||||||||||||||||||||||||||||||||||||||||||||||||||||||||||||||
|
The above chart displays the [Distribution] Percentage of DEMOC and AUTOC Scores and compares the distribution of scores during the early period (1800-1954) with the more recent period of interest (1955-2006). This perspective isolates the two key types of governing authority that are coterminous and may combine to define the patterns of institutionalized authority for any particular governance regime: autocratic (AUTOC) and democratic authority. Whereas the POLITY scale (charted above) combines these two measures to produce a convenient, single, summary indicator of the institutional quality and nature of governing regimes that define a state at any particular moment in time, it is these two, separate measures that provide the dual-authority evaluations that form the theoretical basis of the Polity scheme. The idea of a singular "polity continuum" that combines information on a regime's "autocratic-ness" and "democratic-ness" was not envisioned in the original theory proposed in the seminal work, Patterns of Authority, or it the original Polity (polity-case, Phase I, and annual times series, Phase II) coding schemes. The summary POLITY variable was first included with the Phase IV coding scheme as a convenience and an acknowledgement of its customary use in quantitative analyses by researchers. While there is documented evidence that the combined POLITY scale is useful in summarizing a fairly consistent, non-linear relationship between "coherent" authority institutionalization and the primacy of overt coercion in political relations (see, for example, "POLITY and the Onset of Political Instability, 1955-2006" (following on the Polity main page), researchers must consider carefully what measure(s) of institutionalized regime authority are most appropriate for their particular research design. In different applications, the fully POLITY scale, the individual DEMOC or AUTOC scale(s), or regime categorizations may be most appropriate. The theoretical perspective that provides the foundation of the Polity coding scheme makes no claim that "autocracy" should necessarily be considered a "negative form" or "negation" of "democracy," even though "autocracy" may be best distinguished from "democracy" by its primary reliance on "negative sanctions/incentives" (i.e., instrumental authority) in maintaining cohesion between ruling elites and the non-ruling populace, whereas "democracy" relies mainly on the use of "positive sanctions/incentives" (i.e., legitimate authority) to manage the political agenda and to ensure social order. As evidenced in the chart above, the contemporary period (1955-2006) that has been characterized by the dynamics of decolonization (the emergence of newly independent states) and democratization is distinguished from the "classic" period by 1) a "refinement" of the ideal-types of autocracy and democracy (i.e., more regimes are measured as one form or the other -- with a zero measure in either AUTOC or DEMOC); 2) corresponding increases in the percentages of strongly autocratic or strongly democratic regimes (i.e., scoring high on either the AUTOC or DEMOC scales) and decreasing percentages of weakly autocratic or mixed regimes; and 3) a shift in autocratic authority away from hereditary monarchies (AUTOC = 10) to personalistic and one-party dictatorships (AUTOC = 7, 8, or 9). The combined POLITY scale may approximate an authority-coherency continuum and may be used as such in many applications; however, the researcher must be aware that, by combining separate AUTOC and DEMOC scores, the combined POLITY variable loses, and confounds, some information regarding the actual combination of authority traits. For example, the three middle values on the POLITY scale (-1, 0, and 1) may each be obtained by four different combinations of values on the summed AUTOC and DEMOC variables. The following table lists the occurrences various combinations of AUTOC and DEMOC scores "lost" in the combined POLITY score: |
||||||||||||||||||||||||||||||||||||||||||||||||||||||||||||||||||||||||||||||||||||||||||||||||||||||||||||||||||||||||||||||||||||||||||||||||||||||||||||||||||||||||||||||||||||||||||||||||||||||||||||||||||||||||||||||||||||||||||||||||
|