|
|
|
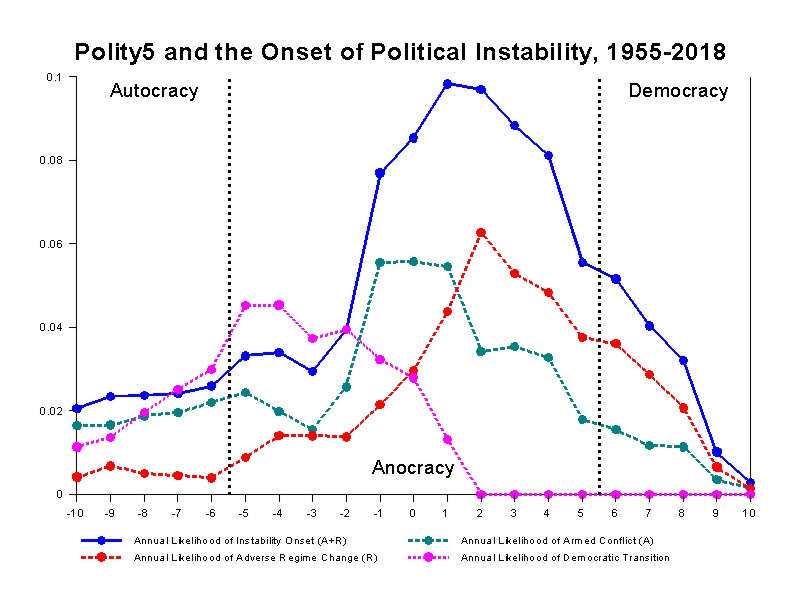
This chart plots the average annual likelihood of the onset of political instability events according to the POLITY2 score of regimes at the point of onset for all cases of political instability for all countries during the contemporary period, 1955-2018 (using Polity5 and PITF Problem Set data). The chart plots four perspectives on political instability using line-and-marker plots. The lines plot the POLITY2 values, which incorporate the POLITY score with periods of "interregnum" (-77 which is given the POLITY score of "0") and interpolated information regarding periods of "transition" (-88); periods of "interruption" (-66) are treated as missing data. All plots exclude cases of political instability that take place at the time of state independence (11 cases). The plots are "smoothed" by taking three-score averages for both POLITY scores and event counts (e.g., the number of POLITY years for POLITY score -7 is calculated by summing the numbers for -6, -7, and -8 and dividing by 3; likewise, the number of instability onsets for POLITY score -7 is calculated by summing the numbers of onsets for -6, -7, and -8 and dividing by three). This "smoothing" technique is consistent with the estimated error in the POLITY scores of +/- 1 point. The blue-solid line plots the average annual likelihood of the onset of any one event from either of the two principal categories of political instability events (A+R): adverse regime changes (R=131 cases; red-dashed line) and ethnic or revolutionary armed conflicts (A=154 cases; green-dashed line). The pink-dashed lines plot the average annual likelihood of the onset of a "major democratic transition" (118 cases). Major democratic transitions disrupt and destabilize status quo authority regimes in ways very similar to "adverse regime changes" even though we may prefer, or even encourage, changes toward greater democratic (or less autocratic) authority. In general terms, discounting "major democratic transitions" in political instability analyses tends to bias findings toward over-emphasizing the volatility and risk associated with democratic transitions and under-estimating the volatility and risk associated with autocratic regimes. Clearly, the relative stability of democratic authority is only realized in the consolidated democracies (+9 and, especially, +10 on the POLITY scale). The various forms of "strongly institutionalized autocracies" are 6 to 10 times more likely to experience an instability event than are the "fully institutionalized democracies" according to the instability analysis presented here. "Non-consolidated democracies" have levels of risk for political instability onset similar to that of the autocracies; the category of "anocracies" have the highest risks of instability onset. Unfortunately, it appears to be quite difficult, but not impossible, to avoid the highened risk associated with the condition of "anocracy" as a preparatory "step" to "fully institutionalized democracy." There were 66 cases of "major democratic transitions" taking place in autocracies (-10 to -6) during the contemporary period and 52 cases in anocracies (-5 to +1). |
Back to Polity Project Page

|
 |

Copyright 2008-2021