|
|
|
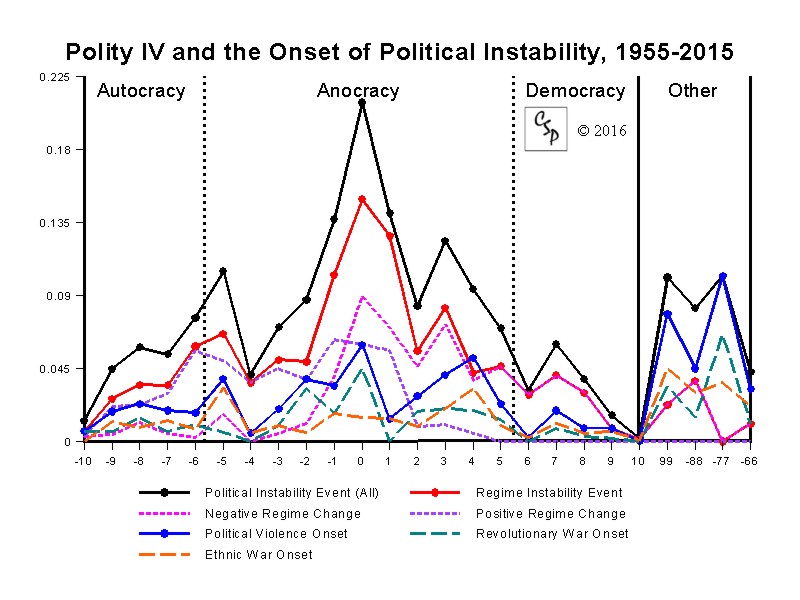
This chart presents the individual plots for the onsets of the four categories of political instability events: positive regime change, negative regime change, ethnic war onset, and revolutionary war onset. The "major democratic transition" category is right-censored by definition (regimes with POLITY scores of 6 or higher can not experience shifts of five points or more). The "adverse regime change" category is strongly left-censored but not completely, as it includes cases involving a "collapse of central authority (-77)" which can occur in any regime. The two "regime change" categories are aggregated as "regime instability events" and the two "(civil) war onset" categories are aggregated as "political violence onsets." All four categories are then aggregated as "political instability events." What may be the most interesting aspect of this distribution of annual likelihoods of instability onsets across the Polity spectrum is that each of the three aggregated plots show similar "inverted U" shapes across the POLITY scale (-10 to +10). Annual likelihood figures for the four "other" categories of Polity conditions: independence (99), transition (-88), interregnum or collapse (-77), and foreign interruption (-66) are all relatively high (similar to the increased likelhood figures for "anocratic" or "incoherent authority" regimes, -5 to +5). It appears that the only (relatively) stable regimes are "fully institutionalized autocratic regimes" (-10; which have diminished in numbers from a peak of 89 in 1977 to just 21 in 2015) and "fully institutionlized democratic regimes" (+10; which have increased steadily from only 9 in 1943 to 96 in 2015).. |
Back to Polity Project Page

|
 |

Copyright 2008-2016