CSP Logo Regional Conflict Trends within the Global System


Regional Trends in Armed Conflict and Governance, 1946-2010

Global System

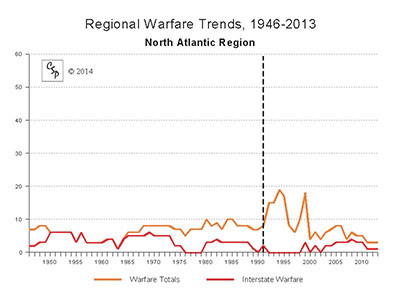
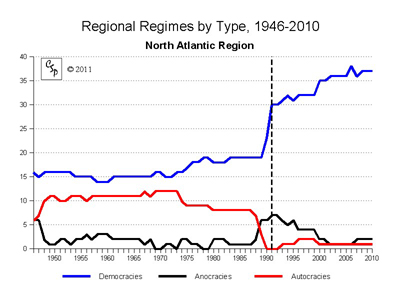
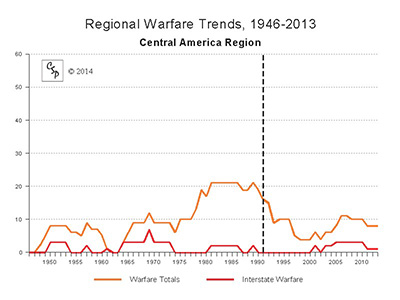
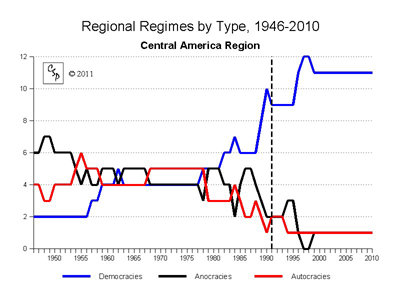
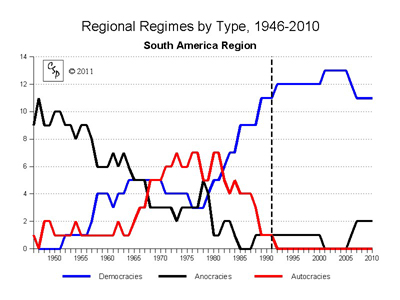
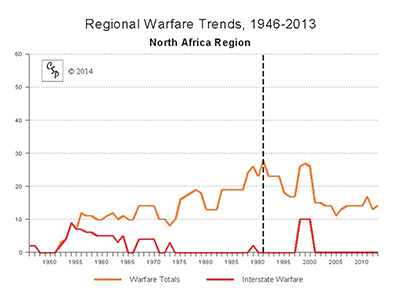
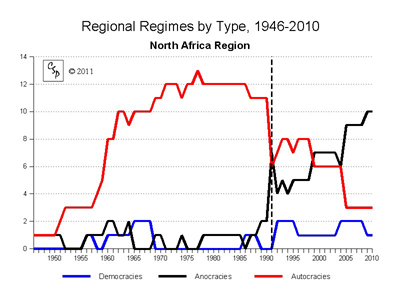
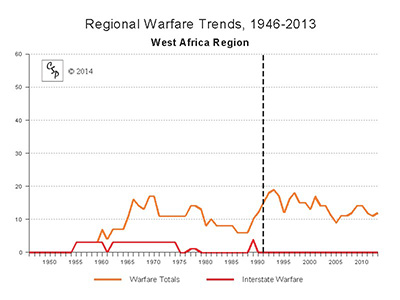
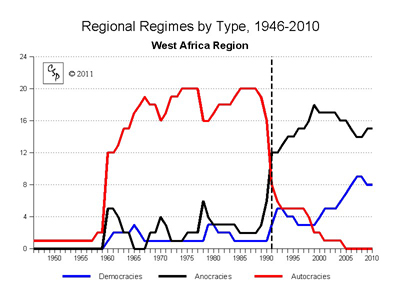
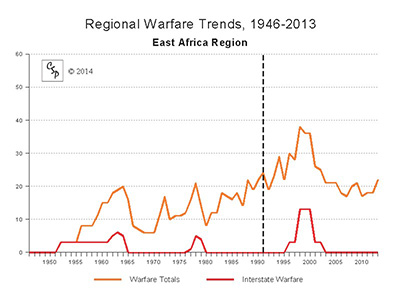
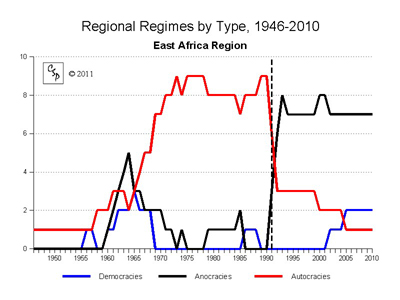
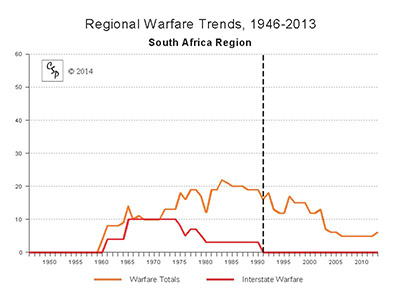
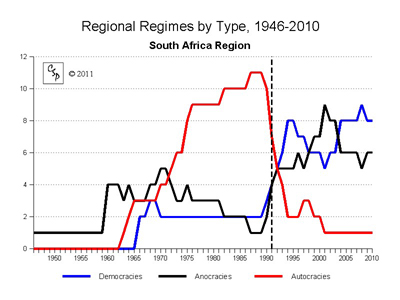
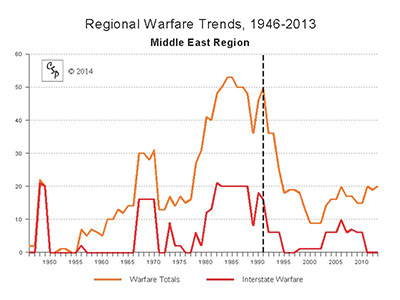
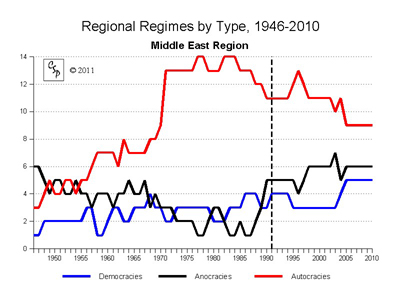
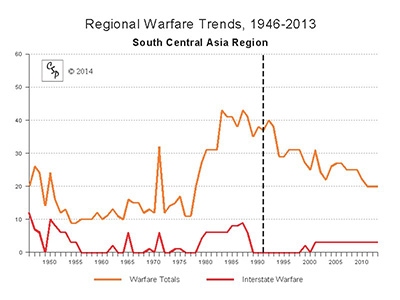
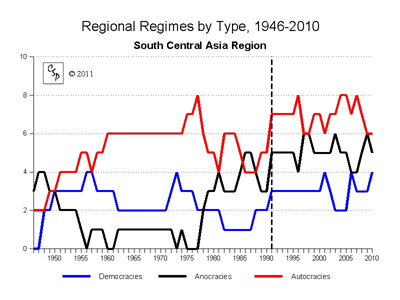
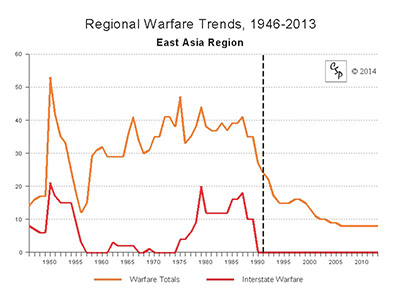
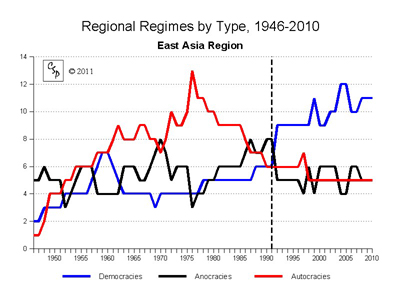
Regional warfare and governance trends (arrayed below) are updated through 2013
and are presented for ten politically-relevant "neighborhood" contexts; solid color countries are listed in only one region and
multi-colored countries are considered "straddle states" and are listed in two or more adjoining regions.
Click the relevant area of the global map above, or the hyperlinks in the table following, to view the regional trends graphs.

North Atlantic Middle East
West Africa South Central Asia
North Africa East Asia
East Africa South America
South Africa Central America

Armed Conflict Drivers in the Early 21st Century

Although the general global trend in armed conflict decreased substantially following the end of the Cold War in 1991, this downward trend has leveled off since the turn of the 21st Century and may even be reversed. Here we list some of the most prominent, observed "conflict drivers" associated with recent onsets of armed conflicts that are contributing to this global counter-trend:

  • Escalation of Long-Standing Disputes or Rivalries. Nearly all of the armed conflicts that crossed the threshold to serious warfare since the end of the Cold War in the 1991 involved an escalation in a long-standing dispute rather than an outbreak of a new conflict.

  • Separatism. Many of the most serious incidents of warfare since 1991 involved escalations in attempts by distinct ethnic groups to gain (or maintain) separation from a central authority unwilling to accept it.

  • Black Market Control. Many of the post-Cold War episodes of major political violence involved conflicts over the control of black market commodities and assets that can be easily liquidated through illicit trade, such as drugs and diamonds. Wars have become a "pay-as-you-go" proposition as the global arms trade becomes increasingly "privatized."

  • Bad Neighborhood Effects. In general, new outbreaks and escalations of serious warfare have tended to occur in particular regions, or "systemic neighborhoods," where ongoing, serious armed conflicts were already taking place, just as they have throughout the contemporary period.

  • Islamic Anti-Globalism. In response to the September 11, 2001, unconventional attacks by hijacked, private airliners on symbolic targets in New York and Washington, DC, US President Bush launched a series of "pre-emptive" engagements against agents of "global terrorism." These engagements have included the forcible ousters of the Taliban regime in Afghanistan in late 2001 and the Saddam Hussein-led Ba'athist regime in Iraq in 2003. The full course and effects of the still emerging "war on terrorism" will have on the global system are not yet fully known. Nearly two-thirds of new wars since 2001 have taken place in Muslim-majority countries or involved Muslim minority groups.

  • Control of Global Oil Reserves. The US invasion of Iraq in April 2003 may mark the first major "enforcement action" to secure the world's oil reserves and ensure that they remain available to and subject of "global market forces." It is also an example of a "domesticized interstate war" as the invasion by US armed forces triggered, first, resistance by Iraqi armed forces, second, an armed resistance by indigenous and foreign militants, and, third, a communal war among Sunni, Shia, and Kurd communal groups. In the first decade of the new millennium, nearly all the world's major oil reserves, outside those located in the northern hemisphere, are secured under strictly autocratic governments, in contrast to the "third wave of democratization" sweeping the rest of the southern states. Increasing competition for oil is placing enormous pressures and strains on non-industrial, oil-producing states and a new global activism among major, oil-consuming states.

  • Humanitarian Disasters in "Global Ghettos." Global investments in societal-system development have long been uneven and the global consequences of the "income and investment differential" are profound, as the Income Distribution charts found on the Comparative Regionalism page vividly display (click here). This imbalance in development and investment across the emerging global system has left "pockets of developmental neglect" where human populations find themselves trapped at bare subsistence levels of societal capacity, making them increasingly vulnerable to the vagaries environmental cycles and within which they face the most fundamental survival imperatives on a daily basis. The irony of well-meaning, foreign humanitarian assistance in these "global ghettos" has been the exascerbation of the survival imperative as local populations increase while the capacity of these areas to sustain life either remains stagnant or deteriorates as a result of increasing demographic pressures. Humanitarian aid without effective developmental assistance increases the potential for severe competition over increasingly strained and scarce resources, environmental- and social-systemic breakdown, and increasing severeand widespread humanitarian disasters. The most severely affected areas in the early 21st century are found across the Sahel and interior regions of Africa and Asia.

The Armed Conflict and Intervention (ACI) and Polity projects are core projects at the Center for Systemic Peace; both of these projects are directed by Monty G. Marshall. The Polity project codes annual data on Political Regime Characteristics and Transitions over the period 1800-2013 for all countries in the world with populations over 500,000 in the most recent year recorded (2013); for more information, click here. The ACI project codes levels of violence in all types of Major Episodes of Political Violence (MEPV) in the world during the period 1946-2013. Major episodes of political violence (armed conflicts) involve at least 500 fatalities and may be of any type: inter-state or intra-state; these include all episodes of international, civil, ethnic, communal, and geno-politicidal violence and warfare. Episodes are coded on a scale of one to ten according to an assessment of the full impact of their violence on the societies that directly experience their effects; the effects of political violence and warfare include fatalities and casualties, resource depletion, destruction of infrastructure, and population dislocations, among other things such as the psychological trauma to individuals and adverse changes to the social psychology and political culture of affected social identity groups. The highest magnitude episode recorded during the contemporary period, 1946-present, is scored at magnitude 7; a magnitude 10 episode would involve total (nuclear, chemical, or biological) annihilation. Category 7 episodes include the Second Vietnamese War, the First Afghanistan War, and the Rwandan Genocide; category 6 episodes include the First Vietnamese War, India Partition, Chinese Civil War, Korean War, Biafran Secession in Nigeria, Bengali Secession in Pakistan, Khmer Rouge Politicide in Cambodia, Angolan Civil War, Salvadoran Civil War, Iran-Iraq War, Mozambiquan Civil War, Second Sudanese Civil War, Bosian Civil War, and the Iraq Implosion following the ouster of Saddam Hussein. The MEPV categories represent standardized event magnitudes based on levels of societal affect (i.e., a measure of the general magnitude that a society's normal networking and functioning is affected by violent disruption); the categories are considered comparable units of measurement. Global and regional trends in warfare are visualized graphically by aggregating the coded scores for all ongoing episodes of major armed conflict in a given year in all independent states. For a more detailed explanation of the MEPV coding methodology, click here. CSP presents the global and regional warfare trends graphs with great confidence in their accuracy, reliability, and comprehensiveness and contends that the foundation for the trends (i.e., the global system) provides a constant "universe of analysis" through the contemporary period (the Era of Globalization). To review the complete listing, "Major Episodes of Political Violence, 1946-2013," used to construct the warfare trends, click here. The ACI project also produces the annual lists of Internal Wars and Failures of Governance used by the US Government-sponsored Political Instability Task Force (PITF; formerly known as the State Failure Task Force, established in 1994). For more information on the data resources and ongoing research of the Task Force, click here.


Politically-Relevant Regions: Warfare and Regimes Trends


North Atlantic Regional Warfare Trends North Atlantic Regional Regimes Trends
North Atlantic Regional Map

Number of countries: 41 (2013)
Population: 1,152,549,000 (2010; 16.85% of global population)

Countries included in the North Atlantic Region:
Albania, Austria, Belgium, Belarus, Bosnia, Bulgaria, Canada, Croatia, Czech Republic, Denmark, Estonia, Finland, France, Germany, Greece, Hungary, Ireland, Italy, Kosovo, Latvia, Lithuania, Luxembourg, Macedonia, Moldova, Montenegro, Netherlands, Norway, Poland, Portugal, Romania, Russia, Serbia, Slovakia, Slovenia, Spain, Sweden, Switzerland, Turkey, Ukraine, United Kingdom, United States

Central America Regional Warfare Trends Central America Regional Regimes Trends
Central America Regional Map

Number of countries: 13 (2013)
Population: 544,796,000 (2010; 7.96% of global population)

Countries included in the Central America Region:
Colombia, Costa Rica, Cuba, Dominican Republic, El Salvador, Guatemala, Haiti, Honduras, Jamaica, Mexico, Nicaragua, Panama, United States

South America Regional Warfare Trends South America Regional Regimes Trends
South America Regional Map

Number of countries: 14 (2013)
Population: 396,496,000 (2010; 5.80% of global population)

Countries included in the South America Region:
Argentina, Bolivia, Brazil, Chile, Colombia, Ecuador, Guyana, Panama, Paraguay, Peru, Suriname, Trinidad and Tobago, Uruguay, Venezuela

North Africa Regional Warfare Trends North Africa Regional Regimes Trends
North Africa Regional Map

Number of countries: 14 (2013)
Population: 361,067,000 (2010; 5.28% of global population)

Countries included in the North Africa Region:
Algeria, Chad, Djibouti, Egypt, Eritrea, Ethiopia, Libya, Mali, Mauritania, Morocco, Niger, Somalia, Sudan, Tunisia

West Africa Regional Warfare Trends West Africa Regiional Regimes Trends
West Africa Regional Map

Number of countries: 22 (2013)
Population: 411,699,000 (2010; 6.02% of global population)

Countries included in the West Africa Region:
Benin, Burkina Faso, Cameroon, Central African Republic, Chad, Congo-Brazzaville, Congo-Kinshasa (Zaire), Equatorial Guinea, Gabon, The Gambia, Ghana, Guinea, Guinea-Bissau, Ivory Coast, Liberia, Mali, Mauritania, Niger, Nigeria, Senegal, Sierra Leone, Togo

East Africa Regional Warfare Trends East Africa Regional Regimes Trends
East Africa Regional Map

Number of countries: 11 (2013)
Population: 352,916,000 (2010; 5.16% of global population)

Countries included in the East Africa Region:
Burundi, Democratic Republic of Congo (Zaire), Eritrea,
Ethiopia, Kenya, Rwanda, Somalia, South Sudan, Sudan, Tanzania, Uganda

South Africa Regional Warfare Trends South Africa Regional Regimes Trends
South Africa Regional Map

Number of countries: 12 (2013)
Population: 233,249,000 (2010; 3.41% of global population)

Countries included in the South Africa Region:
Angola, Botswana, Congo-Brazzaville, Congo-Kinshasa (Zaire), Lesotho, Malawi, Mozambique, Nambia, South Africa, Swaziland, Zambia, Zimbabwe

MIddle East Regional Warfare Trends Middle East Regional Regimes Trends
Middle East Regional Map

Number of countries: 20 (2013)
Population: 435,103,000 (2010; 6.36% of global population)

Countries included in the Middle East Region:
Armenia, Azerbaijan, Bahrain, Cyprus, Egypt, Georgia, Iran, Iraq, Israel, Jordan, Kuwait, Lebanon, Oman, Qatar, Saudi Arabia, Sudan, Syria, Turkey, United Arab Emirates, Yemen

South Central Asia Regional Warfare Trends South Central Asia Regional Regimes Trends
South Asia Regional Map

Number of countries: 15 (2013)
Population: 3,101,152,000 (2010; 45.34% of global population)

Countries included in the South and Central Asia Region:
Afghanistan, Bhutan, Bangladesh, China, India, Iran, Kyrgyzstan, Kazakhstan, Myanmar (Burma), Nepal, Pakistan, Sri Lanka, Tajikistan, Turkmenistan, Uzbekistan

East Asia Regional Warfare Trends East Asia Regional Regimes Trends
East Asia Regional Map

Number of countries: 17 (2013)
Population: 2,191,847,000 (2010; 32.04% of global population)

Countries included in the East Asia Region:
Cambodia, China, East Timor, Indonesia, Korea-North, Korea-South, Laos, Malaysia, Mongolia, Myanmar (Burma), Philippines, Papua New Guinea, Singapore, Taiwan, Thailand, Vietnam


This web page was last updated on April 3, 2014.
To return to the CSP Home Page, click on the CSP logo below.

CSP Home CSP Home
Copyright 1997-2014
West Africa North Africa South America North and Central America North Atlantic East Africa South Africa Middle East South and Central Asia East Asia